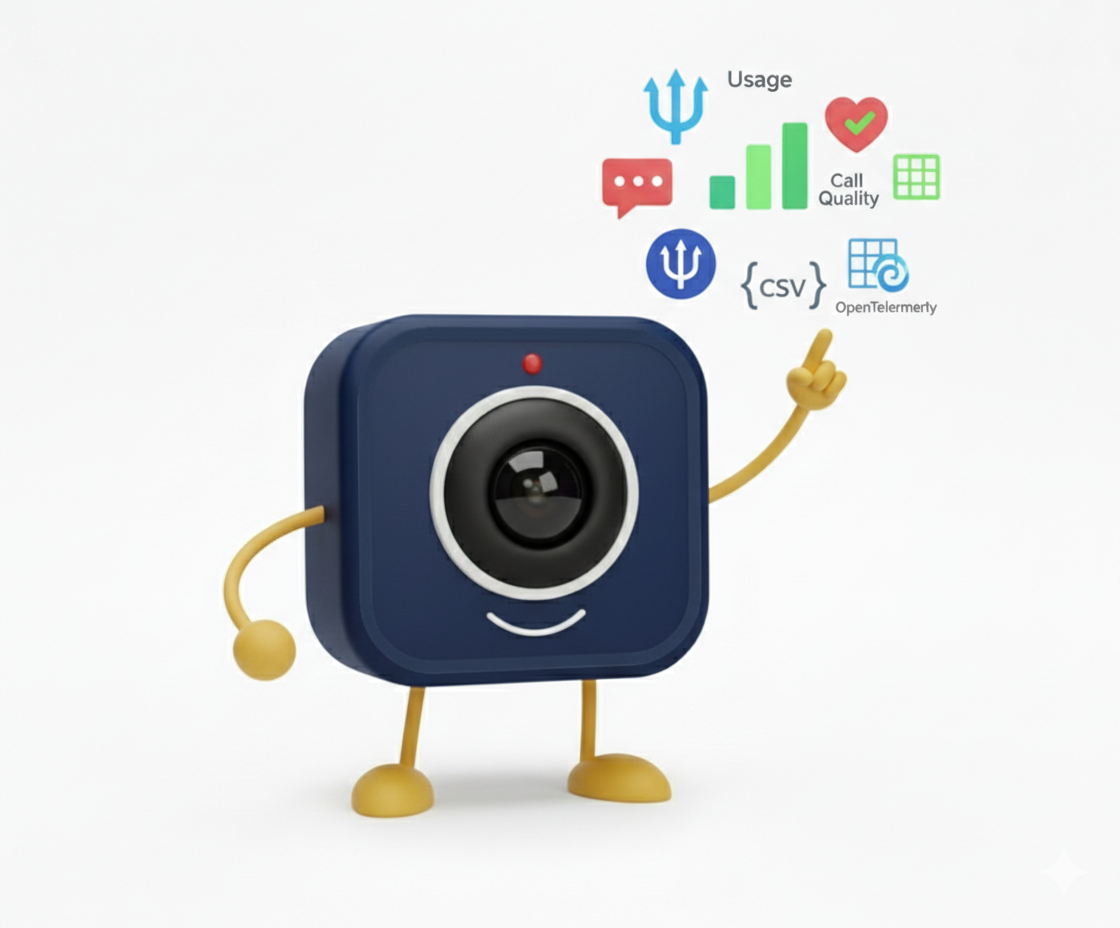
Enterprise Observability: Usage, Health, and Call Quality at a Glance
See exactly how your meeting platform performs. Usage reporting, service health dashboards, call quality metrics, and exportable data in Prometheus, JSON, CSV, or OpenTelemetry keep you in control.
The Need for Full Observability
Enterprise teams need answers to critical operational questions: How many meetings ran this quarter? How many participants joined across regions? How much storage is consumed by recordings and documents? Are all services healthy? Without built-in observability, IT teams are left stitching together fragmented logs, building custom dashboards, and guessing at root causes. DigitalMeet bakes usage, health, and quality metrics directly into the admin experience—giving operations, support, and leadership teams a single pane of glass for the entire platform.
Observability is not optional for enterprise deployments. It drives capacity planning, SLA compliance, chargeback reporting, and proactive incident response. DigitalMeet treats it as a first-class feature, not an afterthought.
Usage Reporting
The usage reporting dashboard provides a comprehensive view of platform activity. Admins can filter data by time period—7, 30, 90, or 365 days—and drill down by organization, team, or meeting type.
Key Usage Metrics
| Metric | Description | Format |
|---|---|---|
| Meeting count | Total meetings by status: scheduled, completed, in progress, cancelled | Integer |
| Participant count | Unique and total participants across all meetings | Integer |
| Average meeting duration | Mean duration of completed meetings | Minutes |
| Peak concurrent meetings | Maximum simultaneous active meetings in the period | Integer |
| Storage usage | Total storage consumed by recordings, documents, and transcripts | GB |
| Feature adoption — Transcription | Percentage of meetings with transcription enabled | Percent |
| Feature adoption — Recording | Percentage of meetings with recording enabled | Percent |
| Feature adoption — AI Summary | Percentage of meetings with AI-generated summaries | Percent |
| Feature adoption — Emotion | Percentage of meetings with emotion detection active | Percent |
| Feature adoption — Signatures | Number of documents e-signed during meetings | Integer |
Usage data fuels capacity planning, license optimization, and internal chargebacks. Export it to CSV for finance teams or pipe it into your BI tool via the API.
Service Health Monitoring
Service health monitoring gives a system-wide view of every microservice in the DigitalMeet stack. Each service reports its status, uptime percentage, average response time, and error rate. The dashboard auto-refreshes so operations and support teams can spot degradation before it becomes an outage.
Health Dashboard Features
- Real-time status indicators — green, yellow, red badges per service
- Uptime tracking — rolling percentage over configurable windows
- Response time trends — p50, p95, and p99 latency per service
- Error rate monitoring — failed requests as a percentage of total
- Dependency mapping — shows which services depend on which, so cascading issues are identified quickly
Tip: Set up alert rules in the admin console to get notified when a service's error rate exceeds a threshold or response time degrades. Combine with your existing PagerDuty or Opsgenie integration via webhook for on-call routing.
Call Quality Metrics
Call quality is the metric that end users feel most directly. DigitalMeet collects and aggregates quality data for every meeting so admins can identify network, regional, or infrastructure issues before users file complaints.
Quality Metrics Collected
| Metric | Description | Threshold (Good) |
|---|---|---|
| Packet loss | Percentage of RTP packets lost in transit | < 1% |
| Round-trip latency | Time for a packet to travel to the peer and back | < 150 ms |
| Jitter | Variation in packet arrival times | < 30 ms |
| Send bitrate | Video/audio bitrate from the local client | > 500 kbps (video) |
| Receive bitrate | Video/audio bitrate received from remote peers | > 500 kbps (video) |
| Frame rate | Rendered video frames per second | > 24 fps |
| Connection type | Direct (P2P) vs. relay (TURN) | Either |
Quality scores are computed per meeting and per participant, then rolled up into organization-level aggregates. Badges—Excellent, Good, Fair, Poor—make it easy to spot trends without reading raw numbers. Filter by region, ISP, or time window to pinpoint problems.
Exportable Metrics and Integrations
DigitalMeet does not assume you will use only its built-in dashboards. All metrics can be exported in the formats your existing observability stack expects.
| Export Format | Use Case | Protocol / Method | Best For |
|---|---|---|---|
| Prometheus | Scraping into Prometheus/Grafana | HTTP /metrics endpoint | Infrastructure teams using Grafana |
| JSON | Custom pipelines, data lakes | REST API pull or webhook push | Engineering teams building dashboards |
| CSV | Spreadsheet analysis, finance reports | Admin console download | Business and finance teams |
| Syslog (RFC 5424) | SIEM ingestion | UDP/TCP syslog | Security and compliance teams |
| OpenTelemetry (OTLP) | Modern observability platforms | gRPC or HTTP OTLP exporter | Teams using Datadog, New Relic, Honeycomb |
Setting Up Metric Exports
- Navigate to Admin Console > Observability > Exports.
- Select the export format(s) you want to enable.
- Configure the destination: endpoint URL, authentication credentials, and export interval.
- Choose which metric categories to include: usage, health, quality, or all.
- Save and verify by checking your monitoring tool for incoming data.
Important: For Prometheus scraping, ensure your network allows inbound connections to the /metrics endpoint. For push-based formats (OTLP, Syslog), ensure the destination is reachable from your DigitalMeet deployment. See Security and Privacy for network guidance.
Building Dashboards and Alerts
With metrics flowing into your observability stack, you can build dashboards tailored to each team. Operations teams might track service health and call quality. Finance teams might track usage for chargebacks. Leadership might want a weekly summary of meeting volume and feature adoption. DigitalMeet provides Grafana dashboard templates for common scenarios, or you can build your own using the exported data.
Alerting rules can be configured both inside DigitalMeet (admin console alerts) and in your external monitoring tool. We recommend layered alerting: DigitalMeet alerts for platform-specific events (e.g., a service restart) and external alerts for infrastructure events (e.g., disk full, network partition).
Frequently Asked Questions
How often are metrics updated?
Usage metrics are updated in near-real-time. Health metrics refresh every 30 seconds. Call quality metrics are computed when a meeting ends and aggregated hourly for organization-level dashboards.
Can I export only call quality metrics?
Yes. Each export channel can be scoped to specific metric categories: usage, health, quality, or any combination.
Is there a Grafana template available?
Yes. DigitalMeet provides pre-built Grafana dashboards for usage, health, and call quality. Import them into your Grafana instance and point them at the Prometheus endpoint.
How do quality scores work?
Quality scores are computed from packet loss, latency, jitter, and bitrate using a weighted formula. The result is a score from 0–100, mapped to badges: Excellent (90–100), Good (70–89), Fair (50–69), Poor (below 50).
Can I set alerts for quality degradation?
Yes. Configure threshold-based alerts in the admin console or in your external monitoring tool using exported metrics. Common triggers include average quality score below 70 or packet loss above 2% for a sustained period.
Does observability cover self-hosted deployments?
Yes. All observability features work identically for cloud-hosted and self-hosted deployments. Self-hosted customers expose the Prometheus endpoint from their own infrastructure.
What retention period applies to metrics?
DigitalMeet retains raw metrics for 90 days by default. Aggregated metrics are retained for one year. Export metrics to your own storage for longer retention. For data retention policies, see Data Residency and Compliance.
Can non-admin users see observability data?
By default, observability dashboards are admin-only. Admins can grant read access to specific roles or groups using role-based permissions.
Ready for enterprise-grade observability? See how DigitalMeet's usage, health, and call quality tools keep your deployment transparent and actionable.