How to Use Meeting Analytics to Find and Fix Productivity Bottlenecks
Meeting analytics reveal what intuition cannot: exactly where your organization's meeting culture is helping or hurting productivity. This tutorial walks you through using DigitalMeet's analytics to identify bottlenecks, diagnose root causes, and implement data-driven fixes that reclaim hours of productive time each week.
Why Meeting Bottlenecks Are Invisible Without Data
Most organizations don't know how much time they spend in meetings—or how much of that time is productive. According to Atlassian's research, the average employee attends 62 meetings per month, and half are considered time wasted. Microsoft's Work Trend Index (2023) found that time spent in meetings tripled between 2020 and 2023, with the average Teams user spending 192% more time in meetings per week.
The hidden cost: Forrester estimates that unproductive meetings cost U.S. businesses $37 billion annually in lost productivity. Without analytics, these costs remain invisible—spread across calendars in 30-minute increments that no one questions.
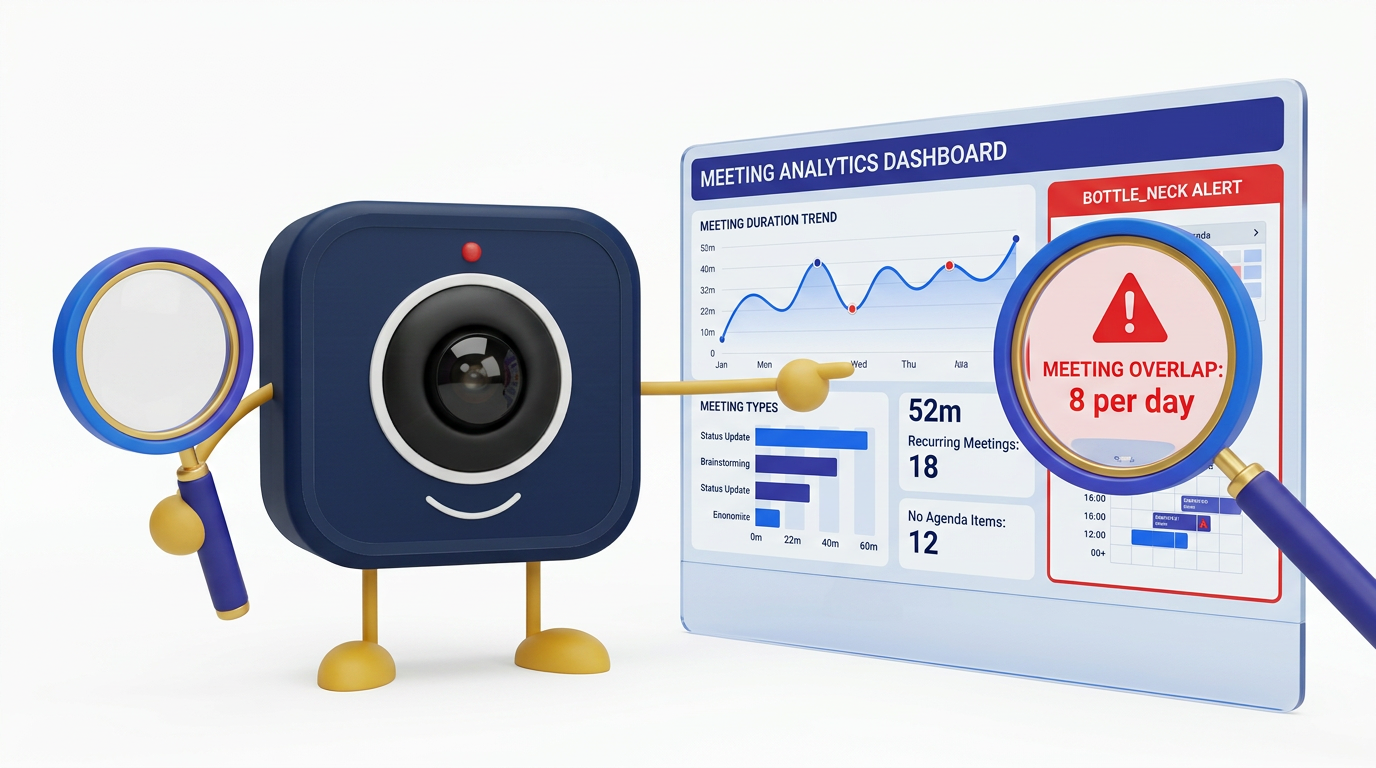
Step 1: Understand Your Metrics
Before you can fix bottlenecks, you need to know what to measure. DigitalMeet's analytics dashboard tracks the following key metrics.
Analytics Metric Definitions and Benchmarks
| Metric | Definition | Healthy Benchmark | Warning Threshold | Critical Threshold |
|---|---|---|---|---|
| Meeting hours per person per week | Total time spent in scheduled meetings | 6–10 hours | 12–15 hours | >15 hours |
| Average meeting duration | Actual time (not scheduled time) | 25–35 minutes | 45–55 minutes | >60 minutes |
| Participation rate | % of invitees who actually attend | >85% | 70–85% | <70% |
| Talk-time ratio (top speaker) | % of meeting time held by the dominant speaker | <30% | 30–50% | >50% |
| Meeting frequency (org-wide) | Total meetings per week per team | 8–15 per team | 16–25 | >25 |
| Late-start rate | % of meetings starting >2 min late | <15% | 15–30% | >30% |
| Recurring meeting ratio | % of meetings that are recurring | 40–60% | 60–75% | >75% |
| No-show rate | % of invitees who don't join | <10% | 10–20% | >20% |
Step 2: Diagnose the Bottleneck
Once you have baseline data, use this framework to map symptoms to root causes and targeted interventions.
Bottleneck Diagnosis Framework
| Symptom (Data Signal) | Likely Root Cause | Diagnostic Question | Recommended Intervention |
|---|---|---|---|
| Meeting hours >15/week for many people | Meeting culture — too many meetings | Which recurring meetings lack clear outcomes? | Audit recurring meetings; cancel or go async |
| Top speaker >50% talk time | Facilitation gap or wrong attendee list | Is the meeting a monologue or a discussion? | Rotate facilitator; reduce audience to decision-makers |
| No-show rate >20% | Low relevance or scheduling conflicts | Are the right people invited? Is the time slot bad? | Trim invite list; survey for better times |
| Meetings consistently run over | No agenda or scope creep | Do meetings have published agendas and time limits? | Require agendas; use DigitalMeet timer |
| Late-start rate >30% | Back-to-back scheduling, no buffers | Are people arriving from other meetings? | Default to 25/50-min meetings for buffers |
| Recurring meeting ratio >75% | Zombie meetings — never re-evaluated | When was each recurring meeting last reviewed? | Quarterly audit; sunset meetings without clear purpose |
Step 3: Build an Action Plan
Diagnosis without action is just data collection. Use this template to translate insights into organizational change.
Meeting Optimization Action Plan Template
| Action Item | Owner | Timeline | Success Metric | Target Improvement |
|---|---|---|---|---|
| Audit all recurring meetings (>4 weeks old) | Team leads | Week 1–2 | Number of meetings cancelled or made async | Reduce recurring meetings by 20% |
| Set default meeting length to 25 minutes | IT admin | Week 1 | Average meeting duration (from analytics) | Reduce avg duration by 10 min |
| Implement no-meeting blocks (e.g. Tue/Thu mornings) | Department heads | Week 2–3 | Focus hours per person per week | Add 4+ focus hours per week |
| Require agendas for meetings >3 people | All organizers | Week 2 | Late-start rate, overrun rate | Reduce late starts by 50% |
| Review analytics monthly | Ops / People team | Ongoing | Sustained improvement in key metrics | Maintain gains quarter over quarter |
Step 4: Measure Impact
After implementing changes, track your metrics over 4–8 weeks. DigitalMeet's trend views let you compare week-over-week and month-over-month. Share high-level results with leadership to build organizational buy-in.
Case example: Organizations that implemented meeting analytics-driven changes with DigitalMeet report reclaiming 4–6 hours per employee per week—equivalent to a full extra day of productive work. At an average fully loaded cost of $75/hour, that's $15,000–$22,500 per employee per year in recovered productivity.
For a deeper dive into the ROI of analytics, see Why Meeting Analytics Matter. For org-wide meeting patterns, explore Analytics and Efficiency. For operational visibility, see Observability.
Advanced Tips
Segment by team: Meeting culture varies across departments. Engineering teams may need different norms than sales teams. Use DigitalMeet's team-level analytics to tailor interventions.
Combine with qualitative data: Pair analytics with brief pulse surveys ("Was this meeting valuable?") to add context to the numbers.
Export and integrate: Export analytics to your BI tool or HR platform for cross-referencing with engagement, burnout, and productivity data.
Frequently Asked Questions
What metrics does DigitalMeet track for meeting analytics? DigitalMeet tracks meeting count, duration (actual vs. scheduled), participation rates, speaking time distribution, engagement indicators, no-show rates, late-start rates, and trends over time. Exact metrics depend on your plan.
Is meeting analytics surveillance? No. DigitalMeet's analytics are designed for improving meeting culture and organizational productivity. Data is aggregated at the team and org level—not used to monitor individuals. Use analytics in line with your privacy and HR policies.
How quickly can we see results from meeting optimization? Most organizations see measurable improvement within 4–6 weeks of implementing analytics-driven changes. Quick wins like setting shorter default meeting lengths and cancelling zombie recurring meetings deliver immediate time savings.
Can we export analytics data? Yes. DigitalMeet supports exporting analytics data for reports, dashboards, and integration with your existing BI or HR tools.
What's the biggest bottleneck most organizations discover? The most common discovery is that recurring meetings consume the majority of calendar time, and many of these meetings have outlived their original purpose. A quarterly recurring meeting audit consistently delivers the highest impact.
How do we get buy-in from leadership for meeting changes? Present the data. Calculate the cost of meeting hours using average fully loaded compensation, then show the projected savings from specific interventions. DigitalMeet's analytics make the business case concrete and measurable.
Should we track individual meeting metrics? Focus on team and org-level patterns rather than individual monitoring. This approach improves culture without creating surveillance concerns. Individual metrics should only be reviewed in coaching contexts with the individual's knowledge.
How do meeting analytics integrate with our existing tools? DigitalMeet analytics can be exported or accessed via API. Integrate with your project management, HR, and BI platforms for a comprehensive view of how meeting culture impacts broader organizational health.